# Load packages
library(vdemdata)
library(tidyverse)

# Create dataset for year 2022, with country name, year, and electoral dem
vdem2022 <- vdem |>
  filter(year == 2022)  |>
  select(
    country = country_name,
    year,
    polyarchy = v2x_polyarchy,
    region = e_regionpol_6C
    ) |>
  mutate(region = case_match(region,
                        1 ~ "Eastern Europe",
                        2 ~ "Latin America",
                        3 ~ "Middle East",
                        4 ~ "Africa",
                        5 ~ "The West",
6 ~ "Asia")) Numerical Data
September 21, 2026
Electoral Democracy Measure
- To what extent is the ideal of electoral democracy in its fullest sense achieved?
- Measure runs from 0 (lowest) to 1 (highest)
- 0.5 is a cutoff for distinguishing electoral democracy from electoral autocracy
The electoral principle of democracy seeks to embody the core value of making rulers responsive to citizens, achieved through electoral competition for the electorate’s approval under circumstances when suffrage is extensive; political and civil society organizations can operate freely; elections are clean and not marred by fraud or systematic irregularities; and elections affect the composition of the chief executive of the country. In between elections, there is freedom of expression and an independent media capable of presenting alternative views on matters of political relevance. – V-Dem Codebook
Other High-Level V-Dem Measures
- Liberal Democracy
- Egalitarian Democracy
- Participatory Democracy
- Deliberative Democracy
All continuous measures, ranging from 0 to 1. Let’s take a look at how to summarize data like this!
Data Setup
Examine the Data
Rows: 179
Columns: 4
$ country   <chr> "Mexico", "Suriname", "Sweden", "Switzerland", "Ghana", "Sou…
$ year      <dbl> 2022, 2022, 2022, 2022, 2022, 2022, 2022, 2022, 2022, 2022, …
$ polyarchy <dbl> 0.584, 0.781, 0.892, 0.893, 0.663, 0.718, 0.823, 0.087, 0.20…
$ region    <chr> "Latin America", "Latin America", "The West", "The West", "A…
How can we summarize measures of democracy? 🤔
We could calculate the mean.
The mean is the average of the values. Common measure of central tendency but sensitive to outliers.
How can we summarize measures of democracy? 🤔
We could calculate the median.
The median is the value that separates the higher half from the lower half of the data.
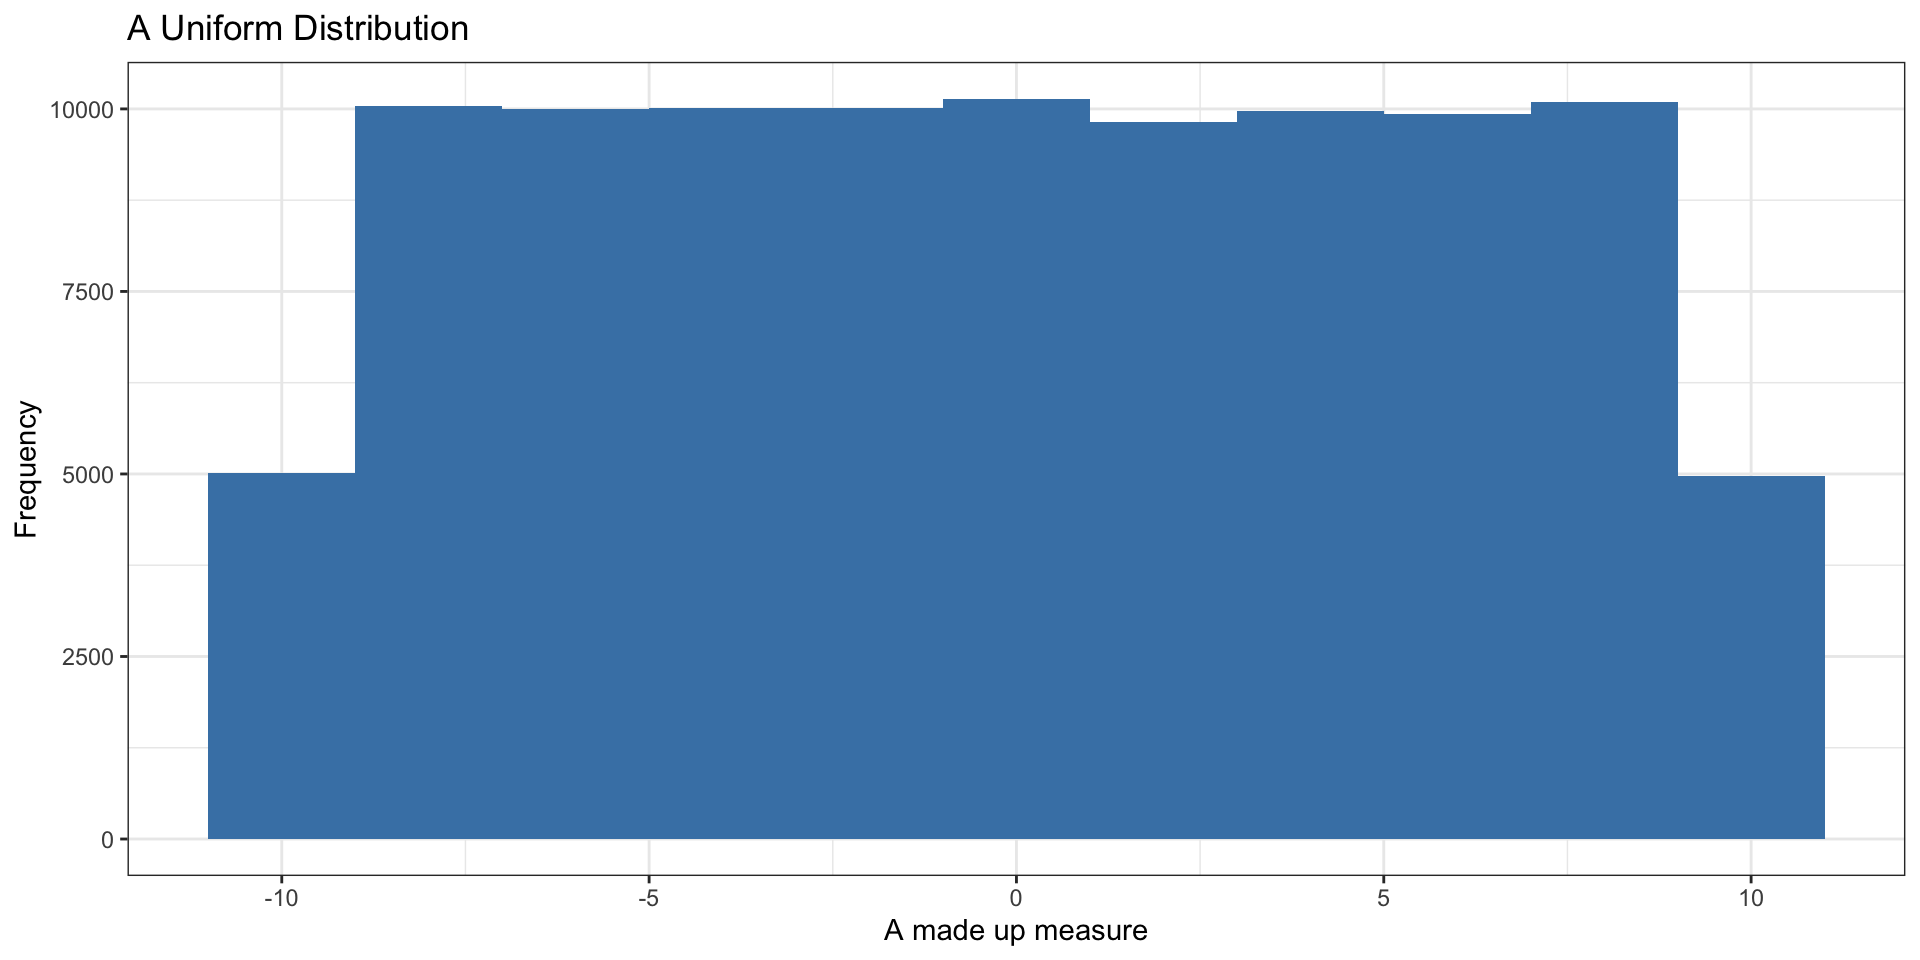
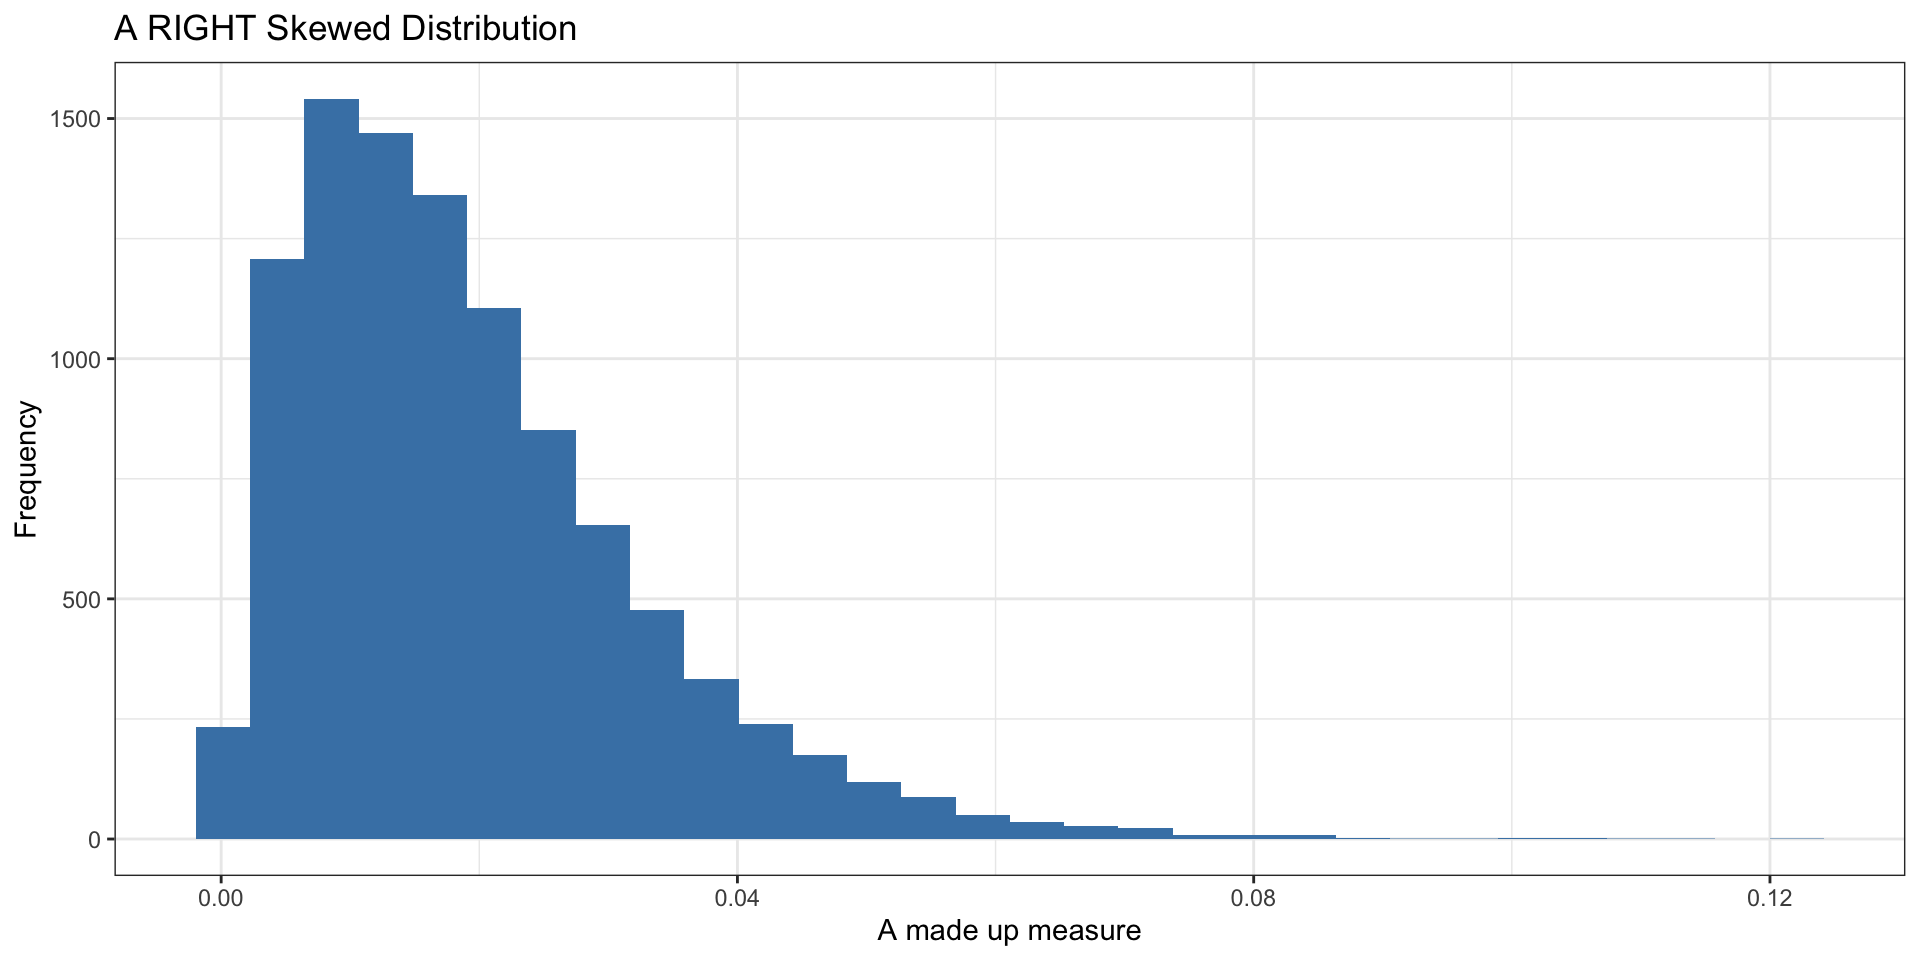
We can also describe the shape of the distribution…
- symmetric (e.g. normal)
- right-skewed
- left-skewed
- unimodal (one peak)
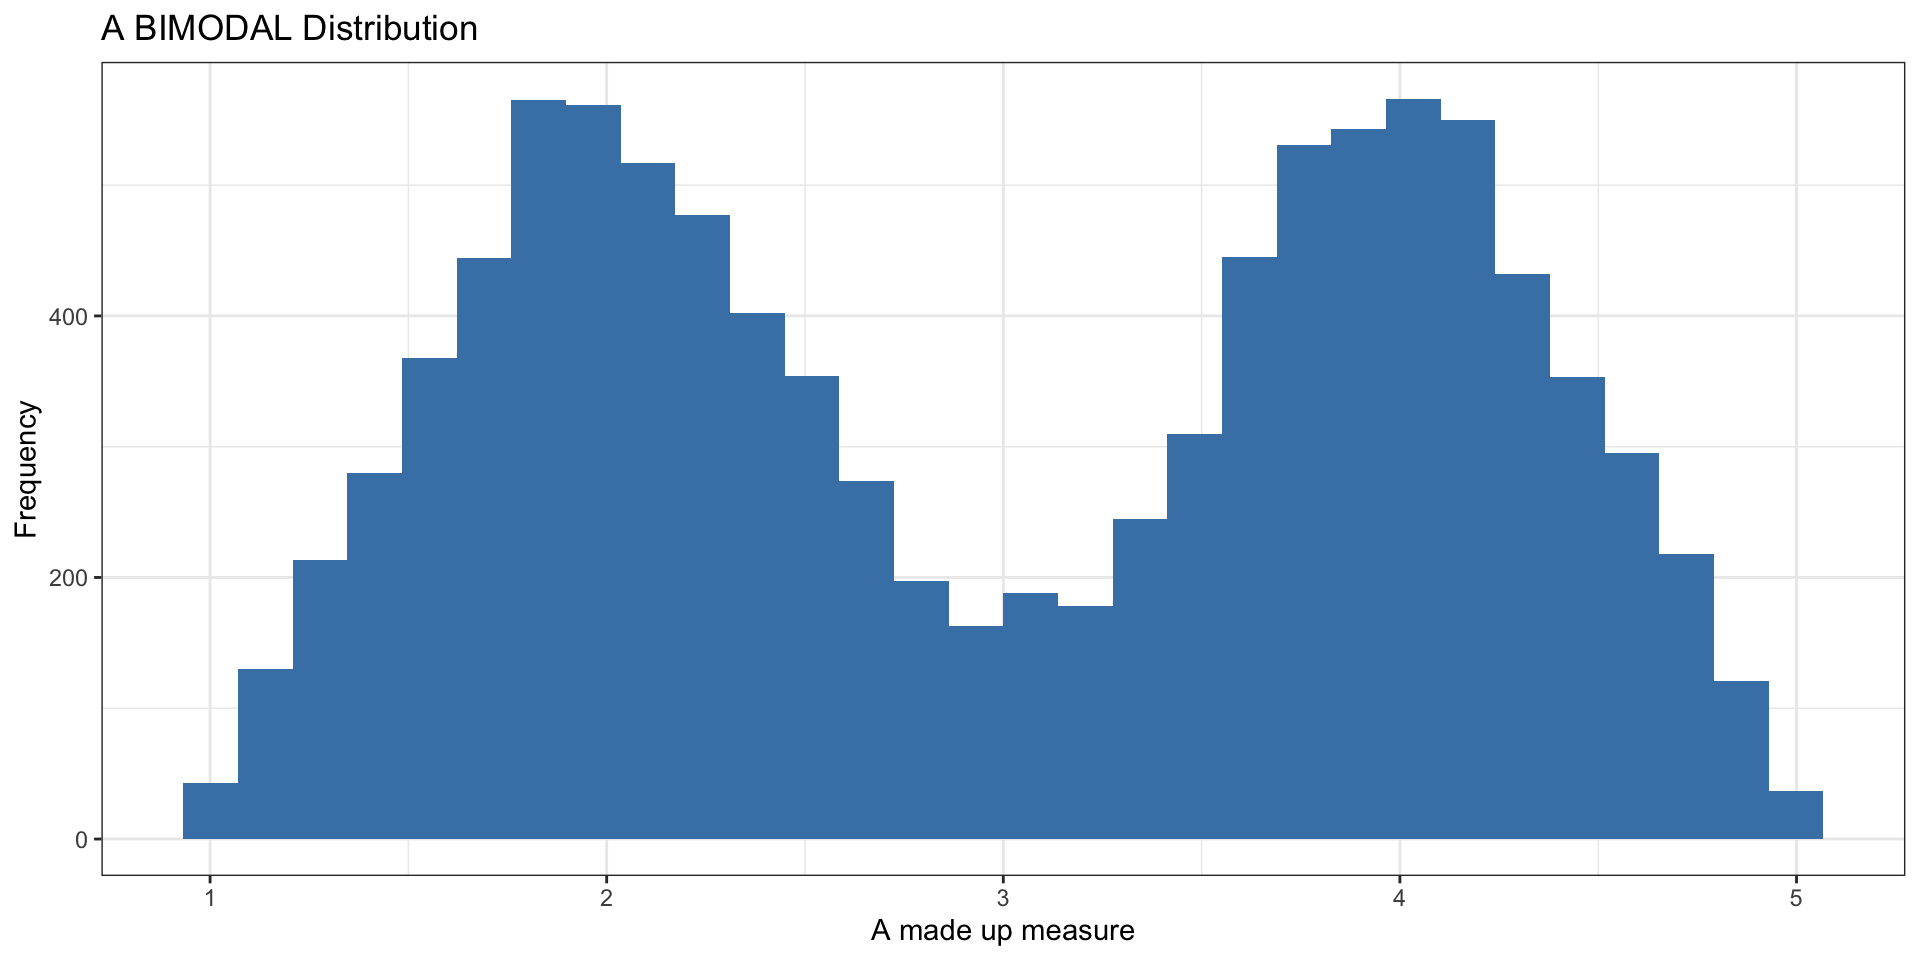
- bimodal (multiple peaks)
Histograms
- Used to represent the distribution of a continuous variable
- The x-axis represents the range of values
- The y-axis represents the frequency of each value
- The bars represent the number of observations in each range or “bin”
- The shape of the histogram can tell us a lot about the distribution of the data
Symmetric Distributions
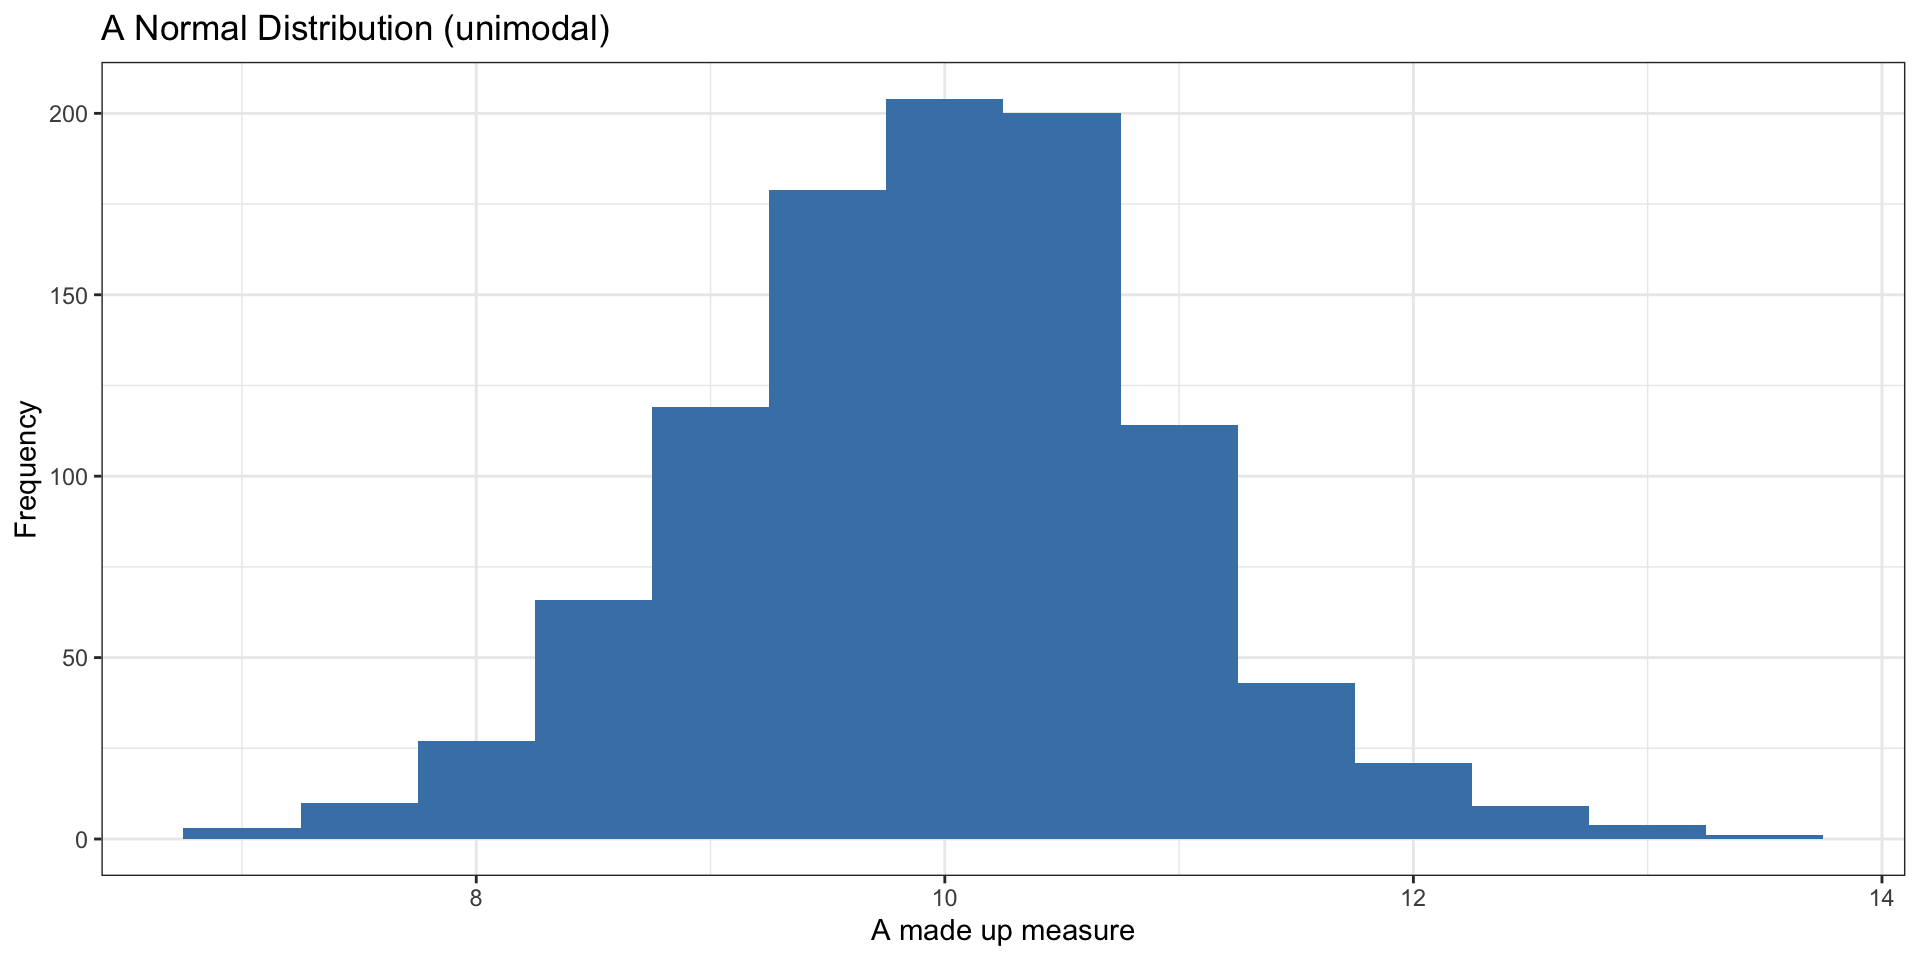
Symmetric Distributions
Skewed Distributions
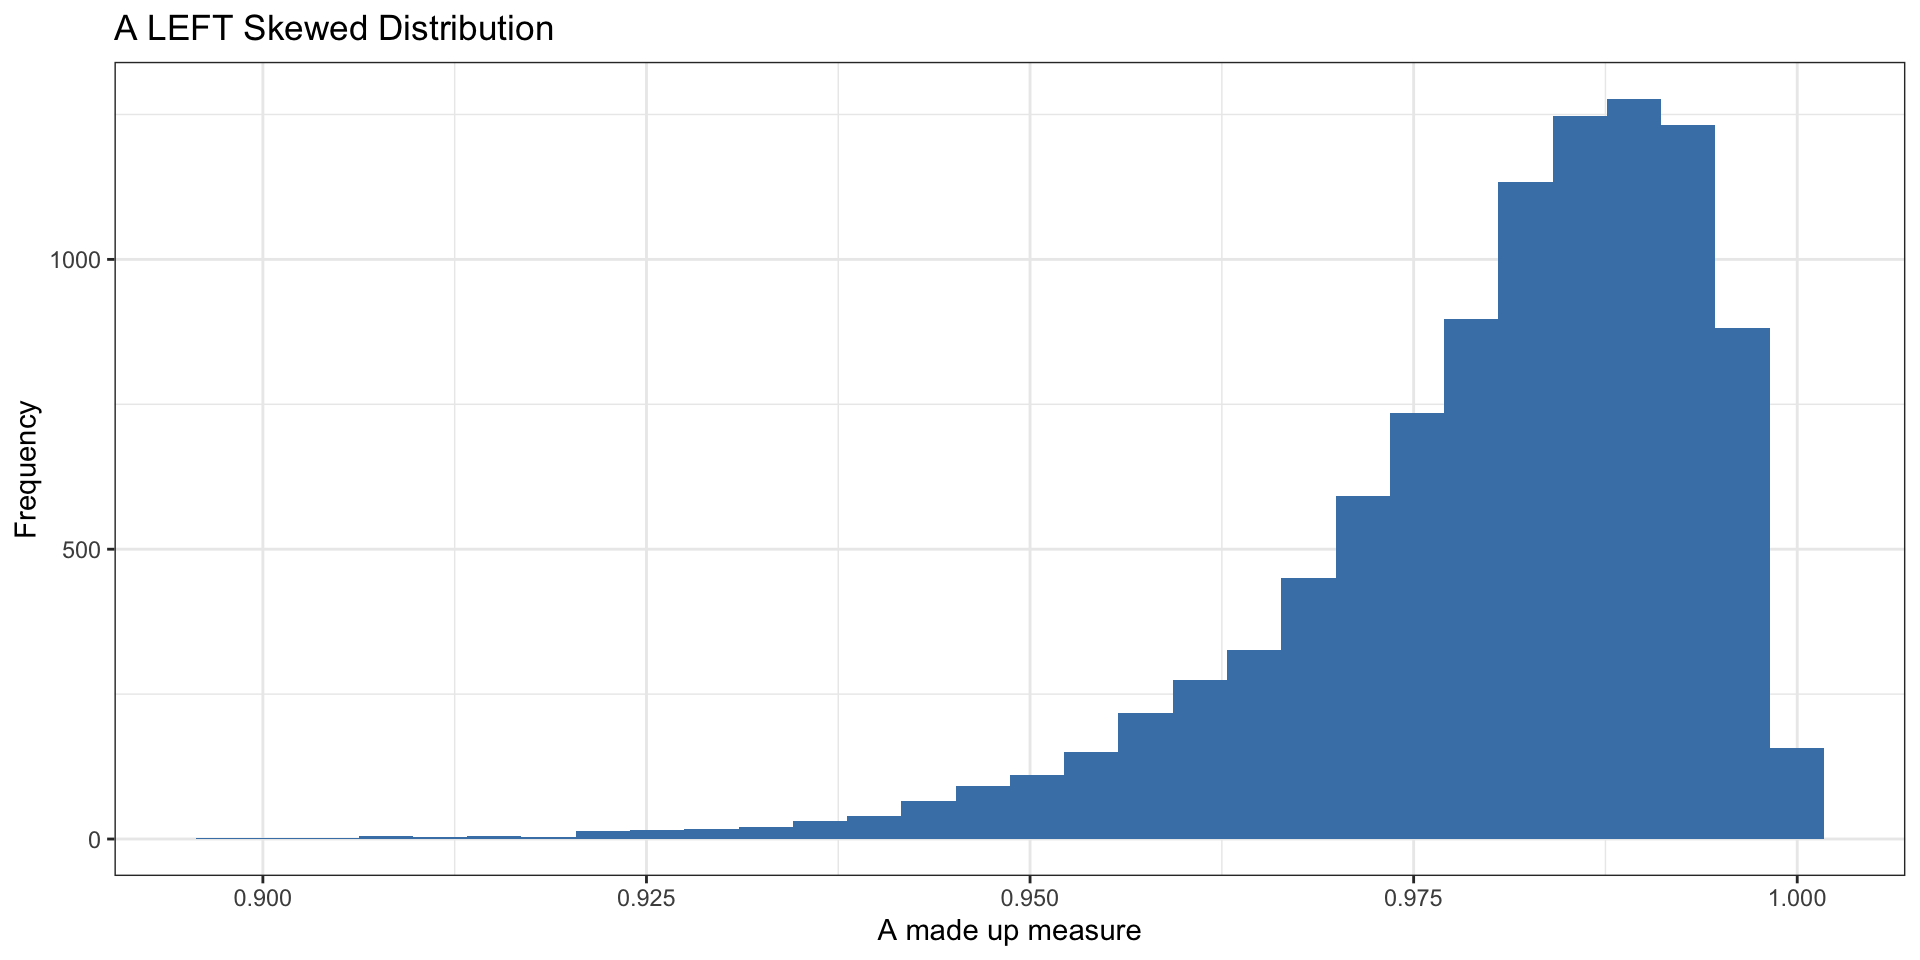
Skewed Distributions
Bimodal Distribution
When is the Mean Useful?
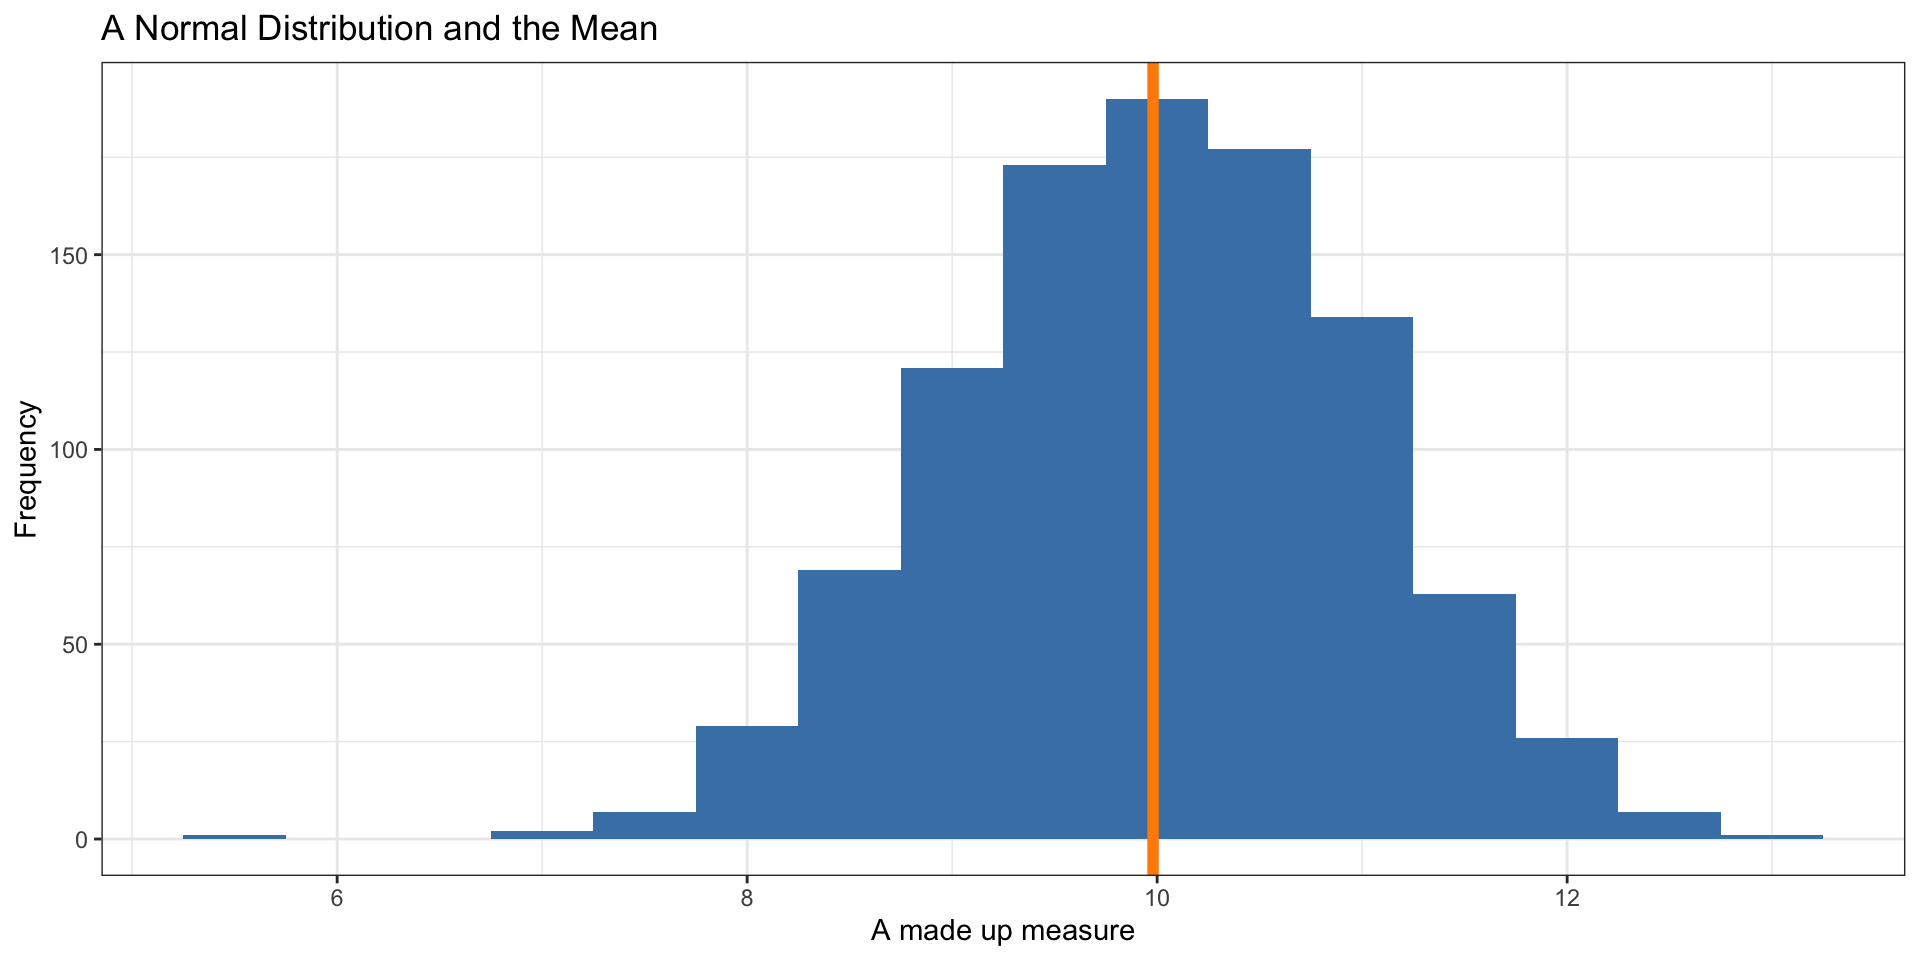
When is the Mean Useful?
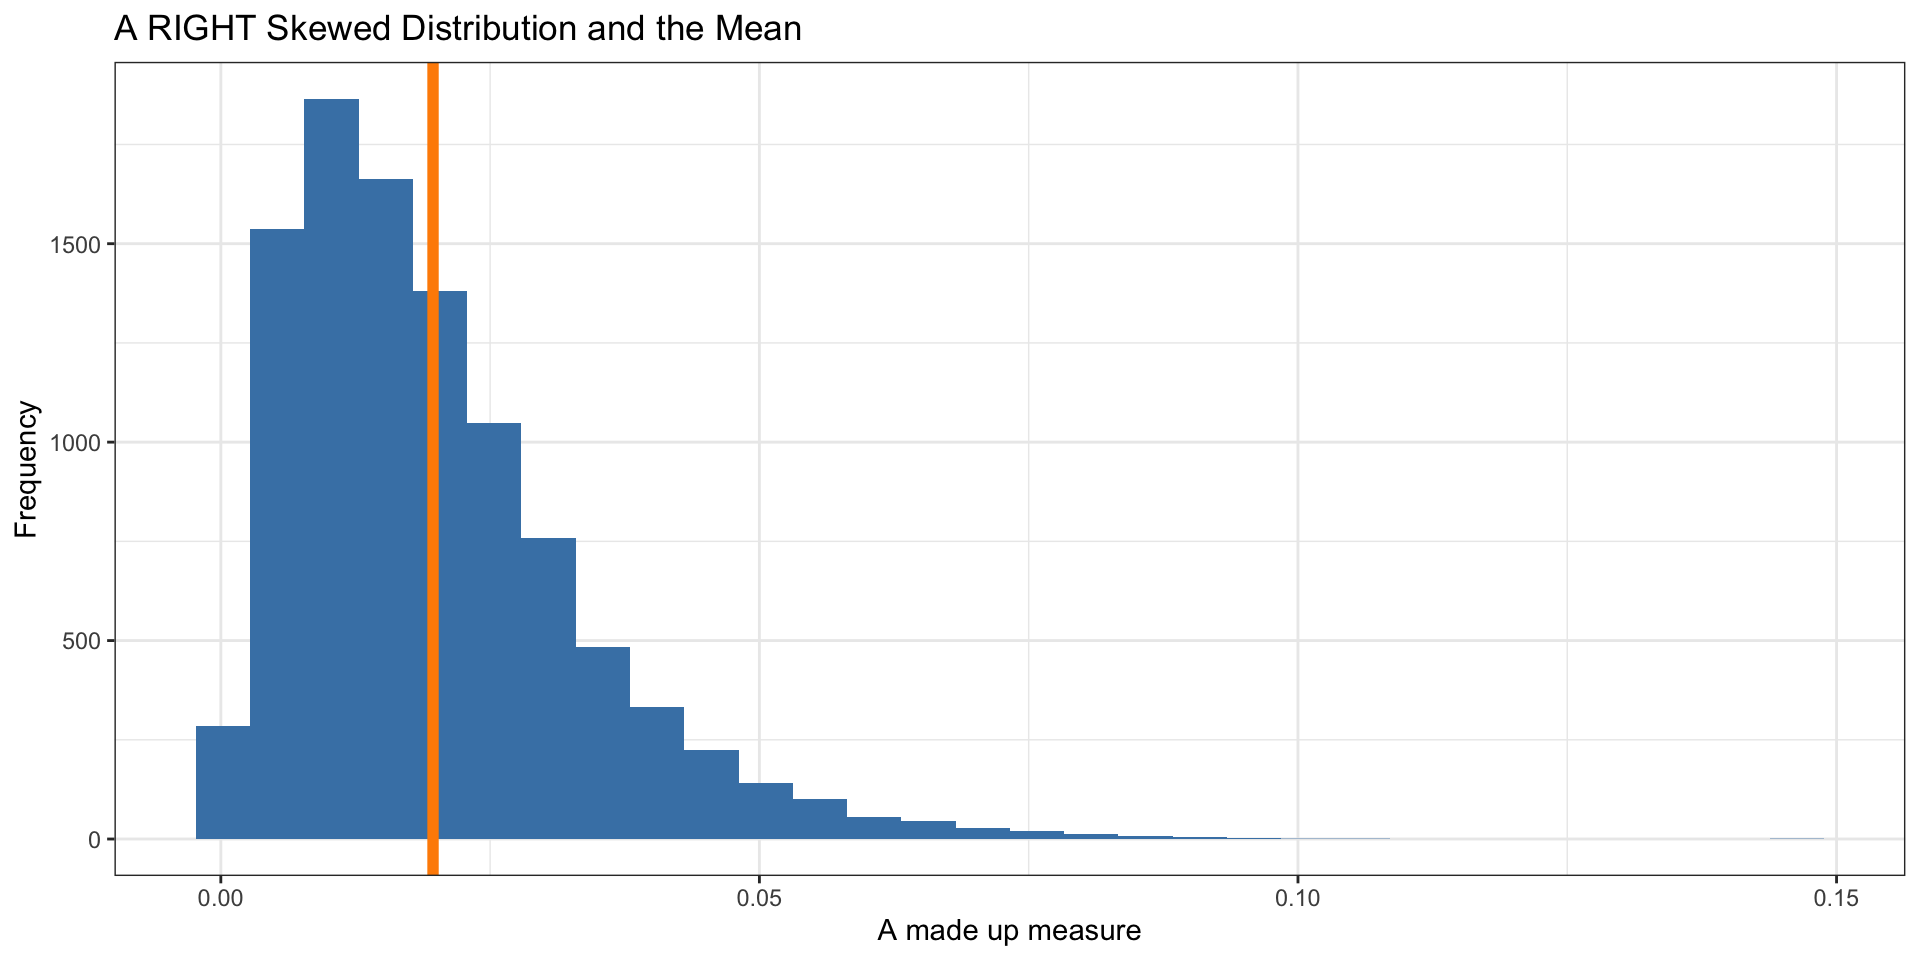
When is the Mean Useful?
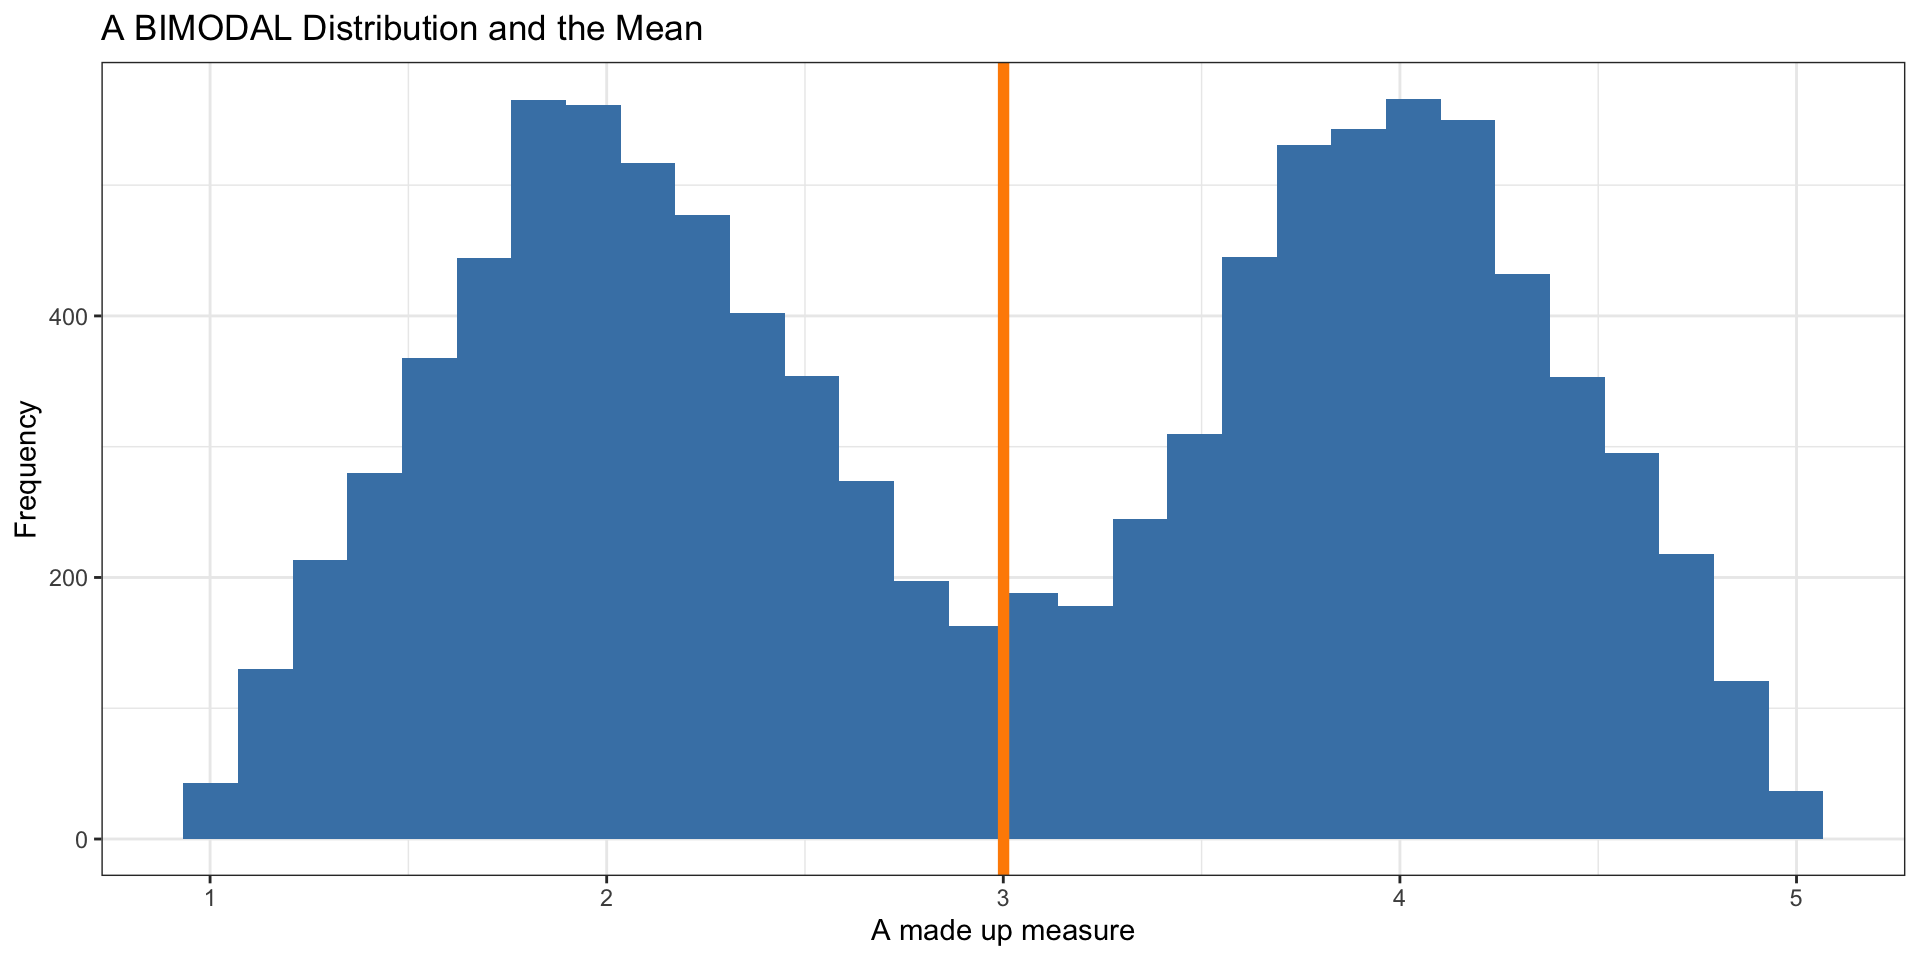
When is the mean useful?
- The Mean works well as a summary statistic when the distribution is relatively symmetric
- Not as well when distributions are skewed or bimodal (or multi-modal)
- With skewed distributions, the mean is sensitive to extreme values
- The median is more robust
Lesson
- Always look at your data!!
- When reading or in a presentation, ask yourself:
- Does the mean make sense given the distribution of the measure?
- Could extreme values in a skewed distribution make the mean not as useful?
- Have the analysts shown you the distribution? If not, ask about it!
Visualize Our Measure
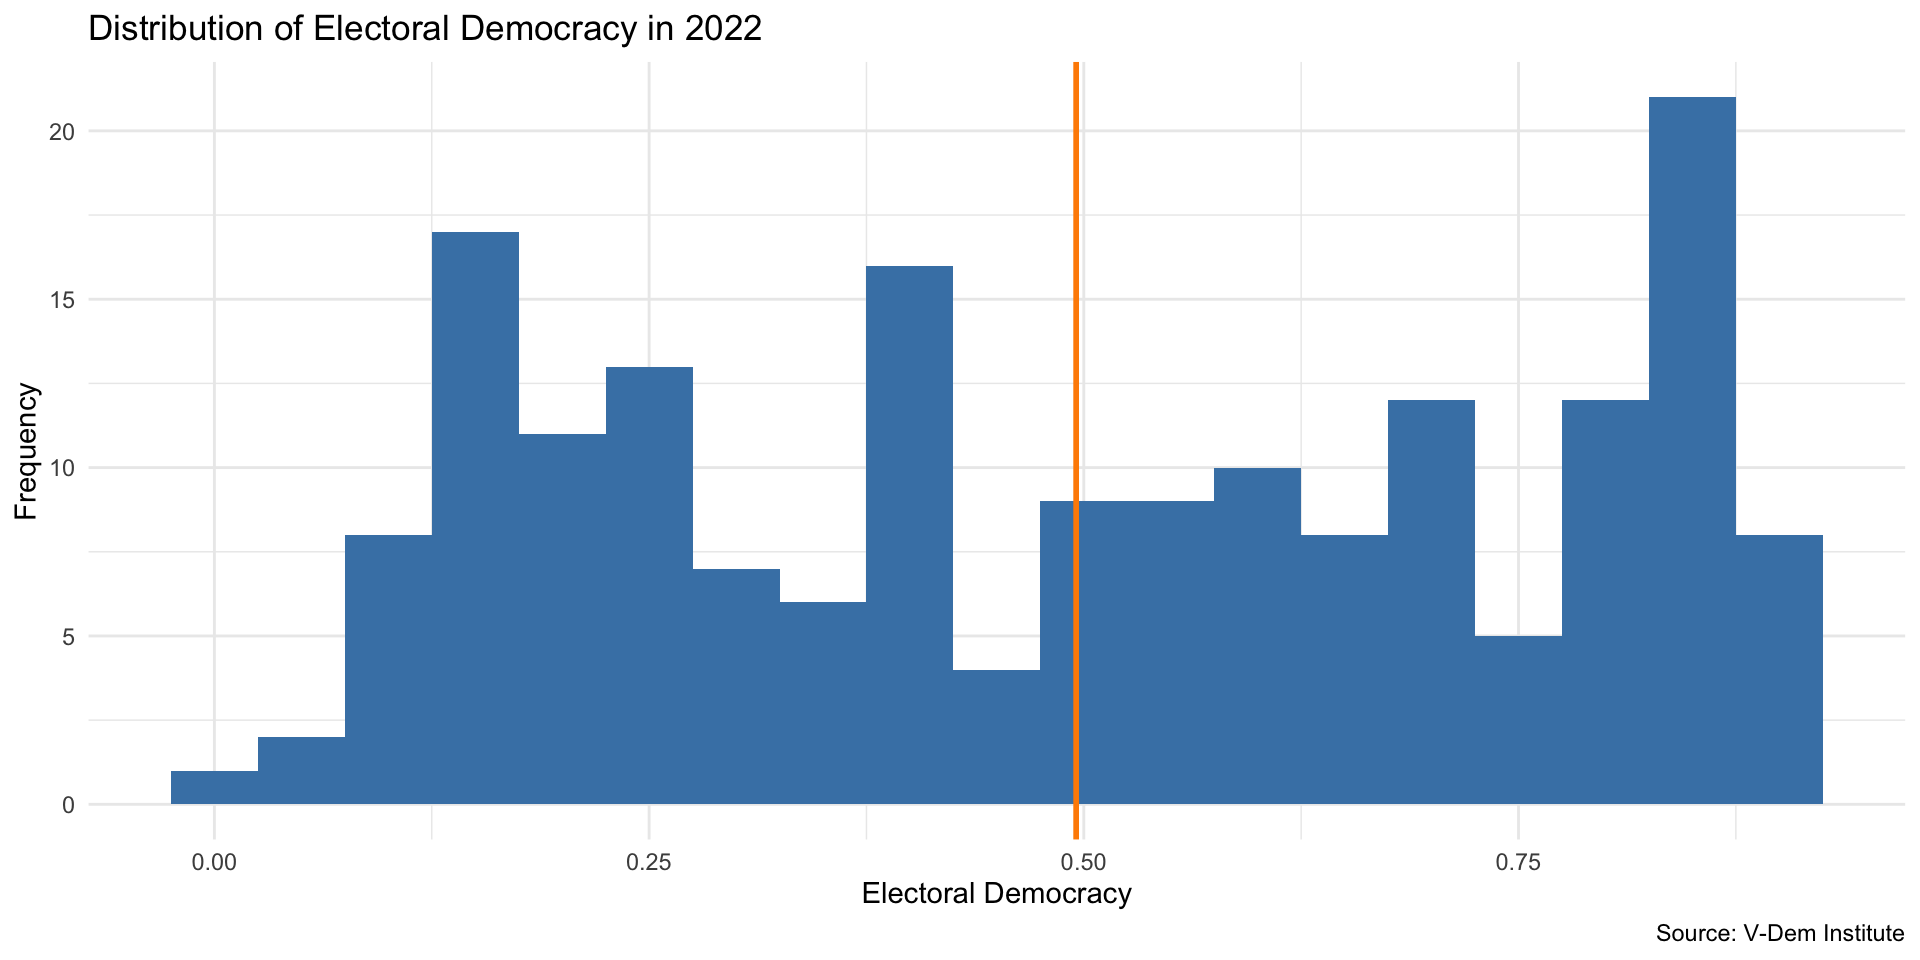
Visualize Our Measure
mn <- mean(vdem2022$polyarchy)
med <- median(vdem2022$polyarchy)

ggplot(vdem2022, aes(x = polyarchy )) +
  geom_histogram(binwidth = .05, fill = "steelblue") +
   labs(
    x = "Electoral Democracy",
    y = "Frequency",
    title = "Distribution of Electoral Democracy in 2022",
    caption = "Source: V-Dem Institute"
  ) +
  geom_vline(xintercept = mn, linewidth = 1, color = "darkorange") +
  theme_minimal()
Visualize Our Measure
mn <- mean(vdem2022$polyarchy)
med <- median(vdem2022$polyarchy)

ggplot(vdem2022, aes(x = polyarchy )) +
  geom_histogram(binwidth = .05, fill = "steelblue") +
   labs(
    x = "Electoral Democracy",
    y = "Frequency",
    title = "Distribution of Electoral Democracy in 2022",
    caption = "Source: V-Dem Institute"
  ) +
  geom_vline(xintercept = mn, linewidth = 1, color = "darkorange") +
  theme_minimal()
Your Turn!
- Look at the V-Dem codebook
- Select a different high-level measure of democracy
- Preprocess your data to include tha measure in your data frame
- Calculate the mean and median and store as a variable
- Visualize the distribution of the measure
- Include a vertical line for the mean
- Now try the median
Recap
- We can use statistics like mean or median to describe the center of a variable
- We can visualize the entire distribution to charachterize the distribution of the variable
- We should also say something about the spread of the distribution
