%% Note: fig-width option not working as of Quarto 1.4, try again in 1.5

flowchart LR
    Client-->|Request|id1[(API)]
    id1[(API)]-->|Response|Client
    id1[(API)]-->Server
    Server-->id1[(API)]
Working with Data
September 21, 2026
Where Does Data Come From?
Thoughts? 😎 💭
- Your boss or a client sends you a file
- Survey data collected by you or someone else
- You can download it from a website
- You can scrape it from a website
- A package (e.g.
unvotes) - You can access it through an API
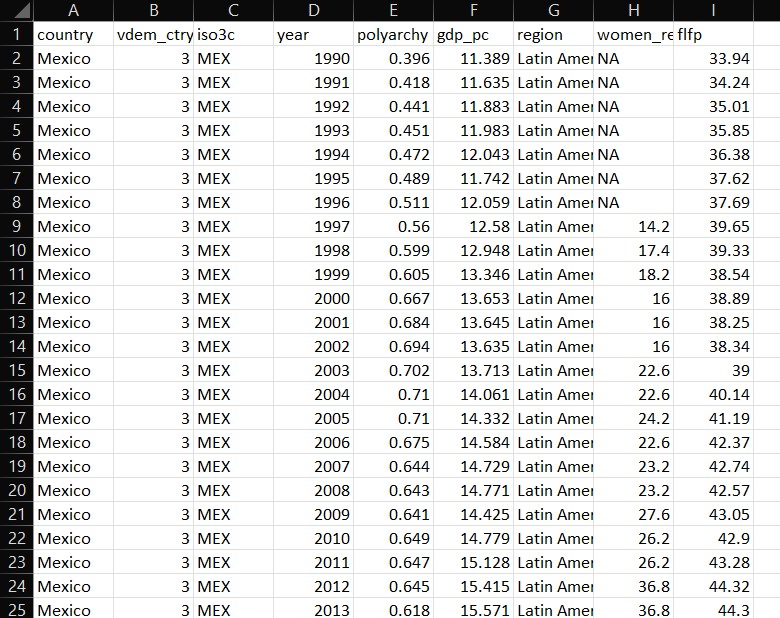
The Concept of “Tidy Data”
- Each column represents a single variable
- Each row represents a single observation
- Each cell represents a single value
Tidy Data Example
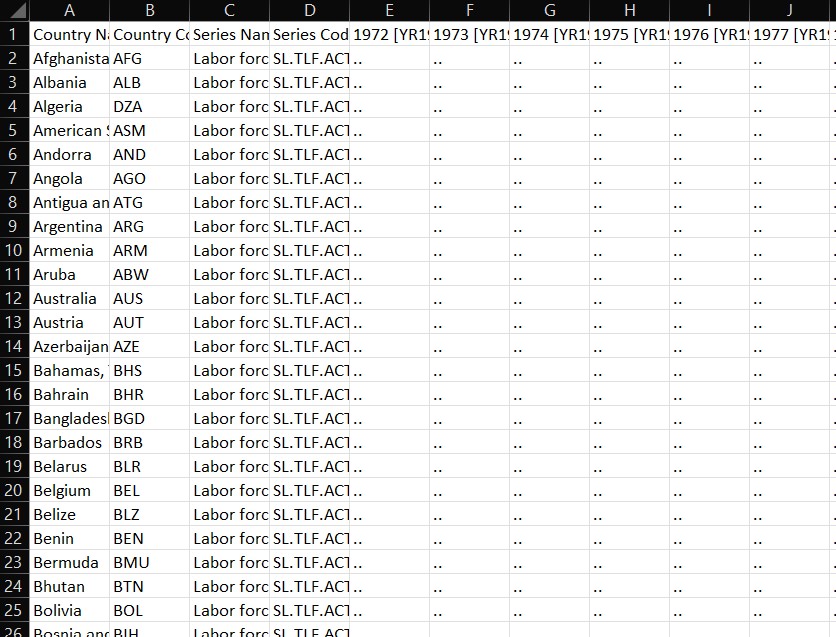
The Concept of “Clean Data”
- Column names are easy to work with and are not duplicated
- Missing values have been dealt with
- There are no repeated observations or columns
- There are no blank observations or columns
- The data are in the proper format
- For example dates should be formatted as dates
Messy Data Example
Which of These is Likely Tidy/Clean?
- Your boss or a client sends you a file
- Survey data collected by you or someone else
- You can download it from a website
- You can scrape it from a website
- A curated collection (e.g.
unvotes) - You can access it through an API
How Do We Get Tidy/Clean Data?
- Wrangle it ourselves
- Use a package where it has been wrangled for us
- Download via an API
APIs
- API stands for “Application Programming Interface”
- Way for two computers to talk to each other
- In this class, we access APIs through packages
Packages in R
- Much easier than reading in data from messy flat file!
- Examples in this course
- Varieties of Democracy (V-Dem) through
vdemdata - World Bank data through
wbstatsorWDI - UN voting data through
unvotes
- Varieties of Democracy (V-Dem) through
- But there are many similar packages out there (please explore!)
This Lesson
- Access V-Dem API with
vdemdataPackage - This is the only package for V-Dem
- Just downloads all the data
- So we have to use
dplyrfunctions likefilter()andselect()
- Run this code and see what happens.
- What is
vdemand what does it do?
filter(), select(), mutate()
filter()is used to select observations based on their valuesselect()is used to select variablesmutate()is used to create new variables or modifying existing ones
filter()
- Run this code. What do you see?
- Try changing the year
- For one year, use
==instead of>= - Or try
<=and see what happens
= versus ==
=is used to assign values to variables, just like<-==is used to test if two values are equal to each other- So
filter(year == 1990)will give you just the observations for 1990
>= and <=
>=is used to test if a value is greater than or equal to another value<=is used to test if a value is less than or equal to another value- So
filter(year >= 1990)will give you the observations for 1990 and later - And
filter(year <= 1990)will give you the observations for 1990 and earlier
select()
- Run this code. What do you see?
- Now try
v2x_libdeminstead ofv2x_polyarchy - Choose more from the codebook
mutate()
- Modify the code to create new variable that is three times the value of
polyarchy - How about
polyarchysquared?
democracy <- vdem |> # download the V-Dem dataset
  filter(year == 2015) |> # keep only observations from 2015
  select(                  # select (and rename) these variables
    country = country_name,     # name before the = sign is new name
    vdem_ctry_id = country_id,  # name after the = sign is old name
    year,
    polyarchy = v2x_polyarchy
    ) |>
  mutate(
    polyarchy_dbl = polyarchy * 2 # create variable 2X polyarchy
  )

glimpse(democracy)
Some Common Arithmetic Operators
+addition-subtraction*multiplication/division^exponentiation (also**)
vdemdata Example
# Load packages
library(vdemdata) # to download V-Dem data
library(dplyr)

# Download the data
democracy <- vdem |> # download the V-Dem dataset
  filter(year == 2015)  |> # filter year, keep 2015
  select(                  # select (and rename) these variables
    country = country_name,     # the name before the = sign is the new name
    vdem_ctry_id = country_id,  # the name after the = sign is the old name
    year,
    polyarchy = v2x_polyarchy,
    gdp_pc = e_gdppc,
    region = e_regionpol_6C
    ) |>
  mutate(
    region = case_match(region, # replace the values in region with country names
                     1 ~ "Eastern Europe",
                     2 ~ "Latin America",
                     3 ~ "Middle East",
                     4 ~ "Africa",
                     5 ~ "The West",
                     6 ~ "Asia")
  )

# View the data
glimpse(democracy)
Use filter() to select years…
# Download the data
democracy <- vdem |>
  filter(year == 2015)  |> # keep 2015
  select(
    country = country_name,
    vdem_ctry_id = country_id,
    year,
    polyarchy = v2x_polyarchy,
    gdp_pc = e_gdppc,
    region = e_regionpol_6C
    ) |>
  mutate(
    region = case_match(region,
                     1 ~ "Eastern Europe",
                     2 ~ "Latin America",
                     3 ~ "Middle East",
                     4 ~ "Africa",
                     5 ~ "The West",
                     6 ~ "Asia")
  )
Use select() to choose variables…
# Download the data
democracy <- vdem |>
  filter(year == 2015)  |>
  select(                  # select (and rename) these variables
    country = country_name,     # the name before the = sign is the new name
    vdem_ctry_id = country_id,  # the name after the = sign is the old name
    year,
    polyarchy = v2x_polyarchy,
    gdp_pc = e_gdppc,
    region = e_regionpol_6C
    ) |>
  mutate(
    region = case_match(region,
                     1 ~ "Eastern Europe",
                     2 ~ "Latin America",
                     3 ~ "Middle East",
                     4 ~ "Africa",
                     5 ~ "The West",
                     6 ~ "Asia")
  )
Use mutate with case_match() to Recode Region….
# Download the data
democracy <- vdem |>
  filter(year == 2015)  |>
  select(
    country = country_name,
    vdem_ctry_id = country_id,
    year,
    polyarchy = v2x_polyarchy,
    gdp_pc = e_gdppc,
    region = e_regionpol_6C
    ) |>
  mutate(
    region = case_match(region, # replace the values in region with country names
                     1 ~ "Eastern Europe",
                     2 ~ "Latin America",
                     3 ~ "Middle East",
                     4 ~ "Africa",
                     5 ~ "The West",
                     6 ~ "Asia")
                    # number on the left of the ~ is the V-Dem region code
                    # we are changing the number to the country name on the right
                    # of the equals sign
  )
Save It!
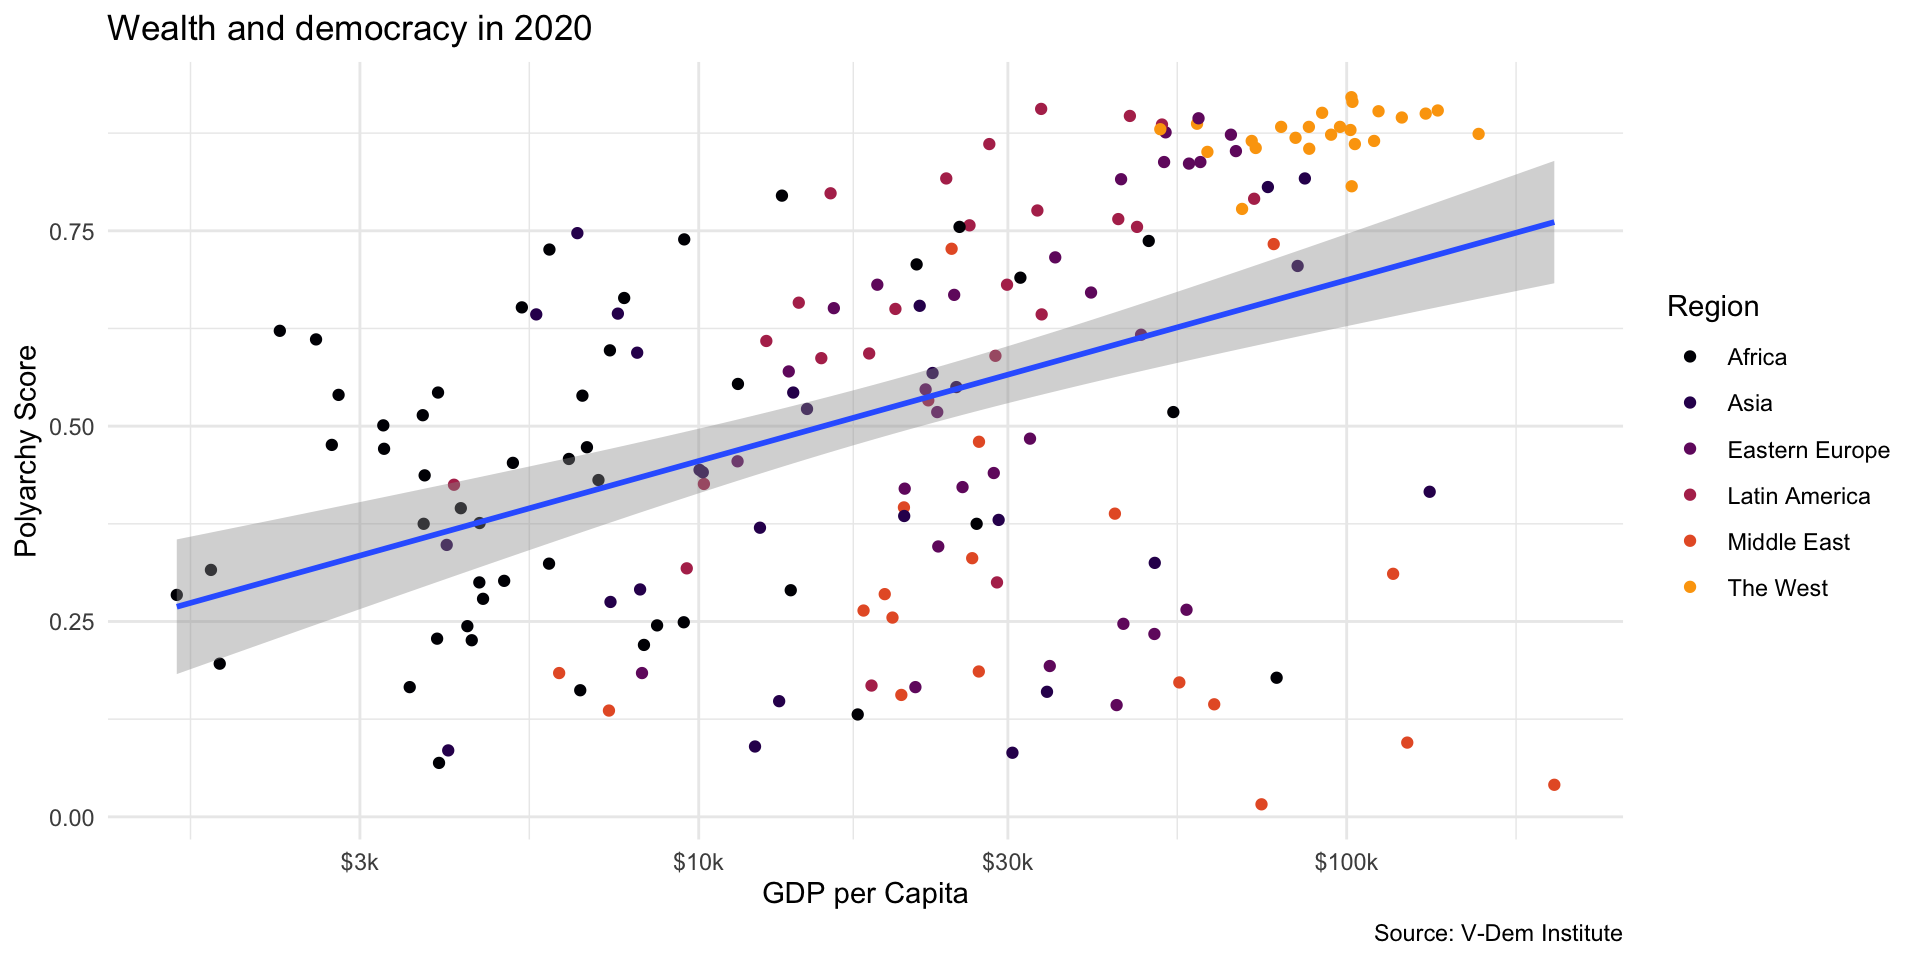
Visualize It!
library(ggplot2)

ggplot(democracy, aes(x = gdp_pc, y = polyarchy)) +
  geom_point(aes(color = region)) +
  geom_smooth(method = "lm", linewidth = 1) +
  scale_x_log10(labels = scales::label_number(prefix = "$", suffix = "k")) +
  labs(
    x= "GDP per Capita",
    y = "Polyarchy Score",
    title = "Wealth and democracy in 2015",
    caption = "Source: V-Dem Institute",
    color = "Region"
    ) +
  scale_color_viridis_d(option = "inferno", end = .8)
Visualize It!
Try it Yourself
- Go to the V-Dem Codebook
- Select a democracy indicator from Part 2.1 (high level indicators) to visualize
- Note the indicator code (e.g. “v2x_polyarchy” for the polyarchy score)
- Change the code and download the data so you can visualize it
- Now make a scatter plot of your indicator versus GDP
- Bonus: How would you make a line chart?
